
All five tools in 90 seconds
Five tools built on the same data professional podcast teams rely on.
No login. No card. No catch.
All five tools in 90 seconds
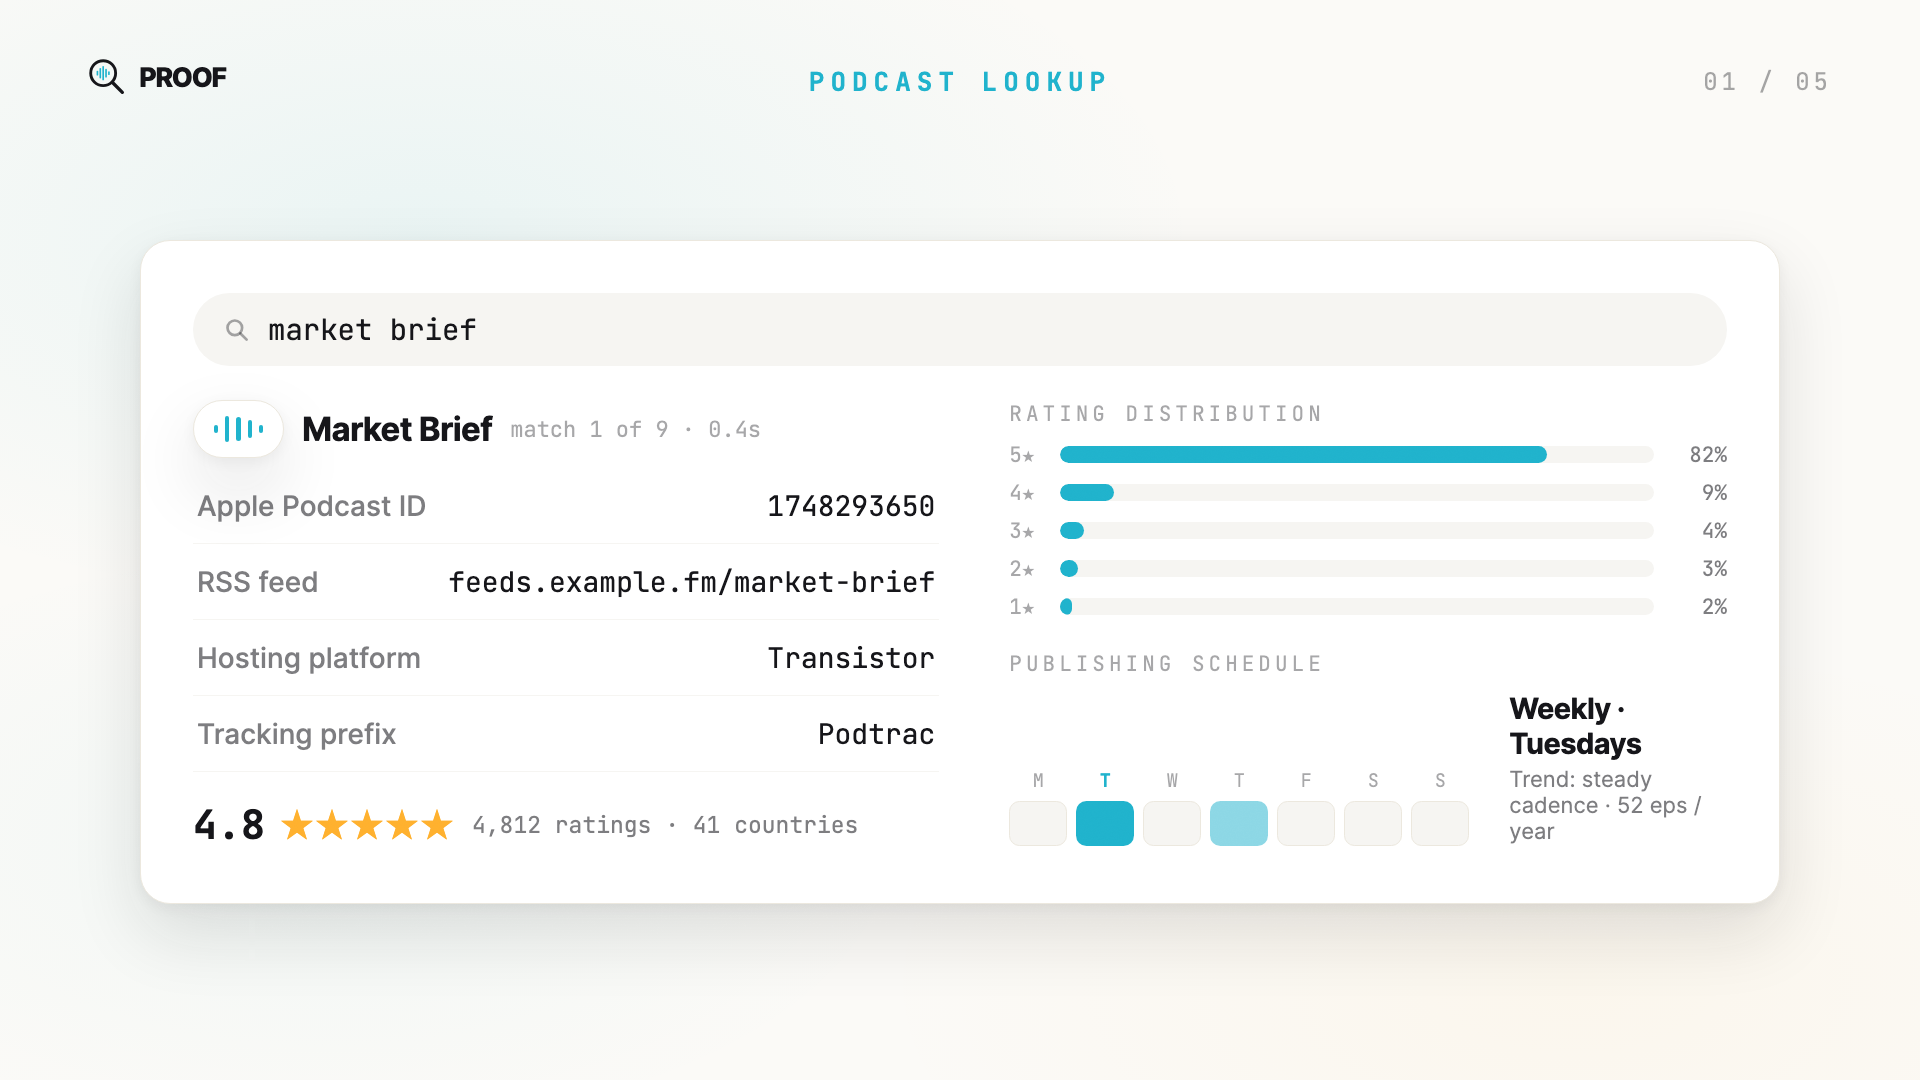
Type a show name and get its Apple ID, RSS feed, hosting platform, tracking prefix, rating distribution, and publishing trends. Instantly. Then compare any two shows side by side.
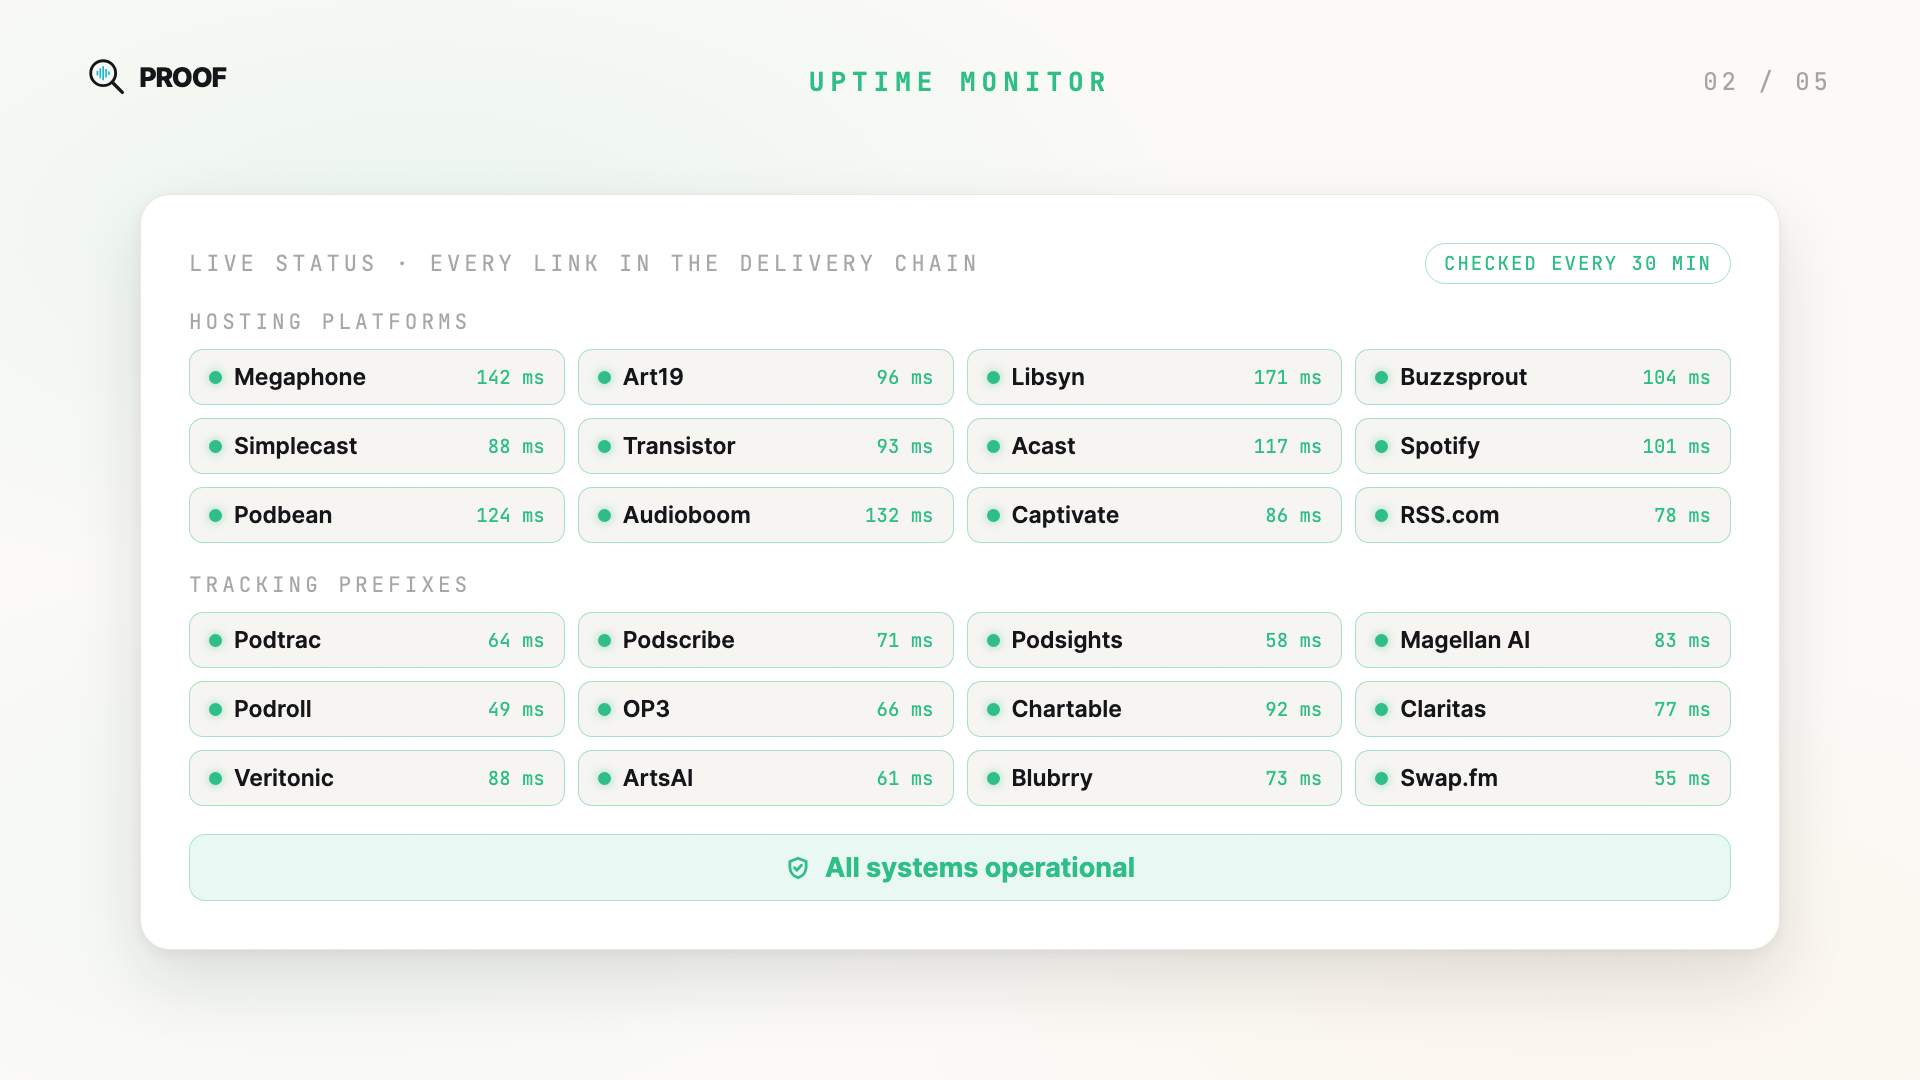
Live status for podcast hosting platforms and tracking prefixes. Every link in the delivery chain, checked every 30 minutes, with response times and history. When something breaks, see exactly which link is down.
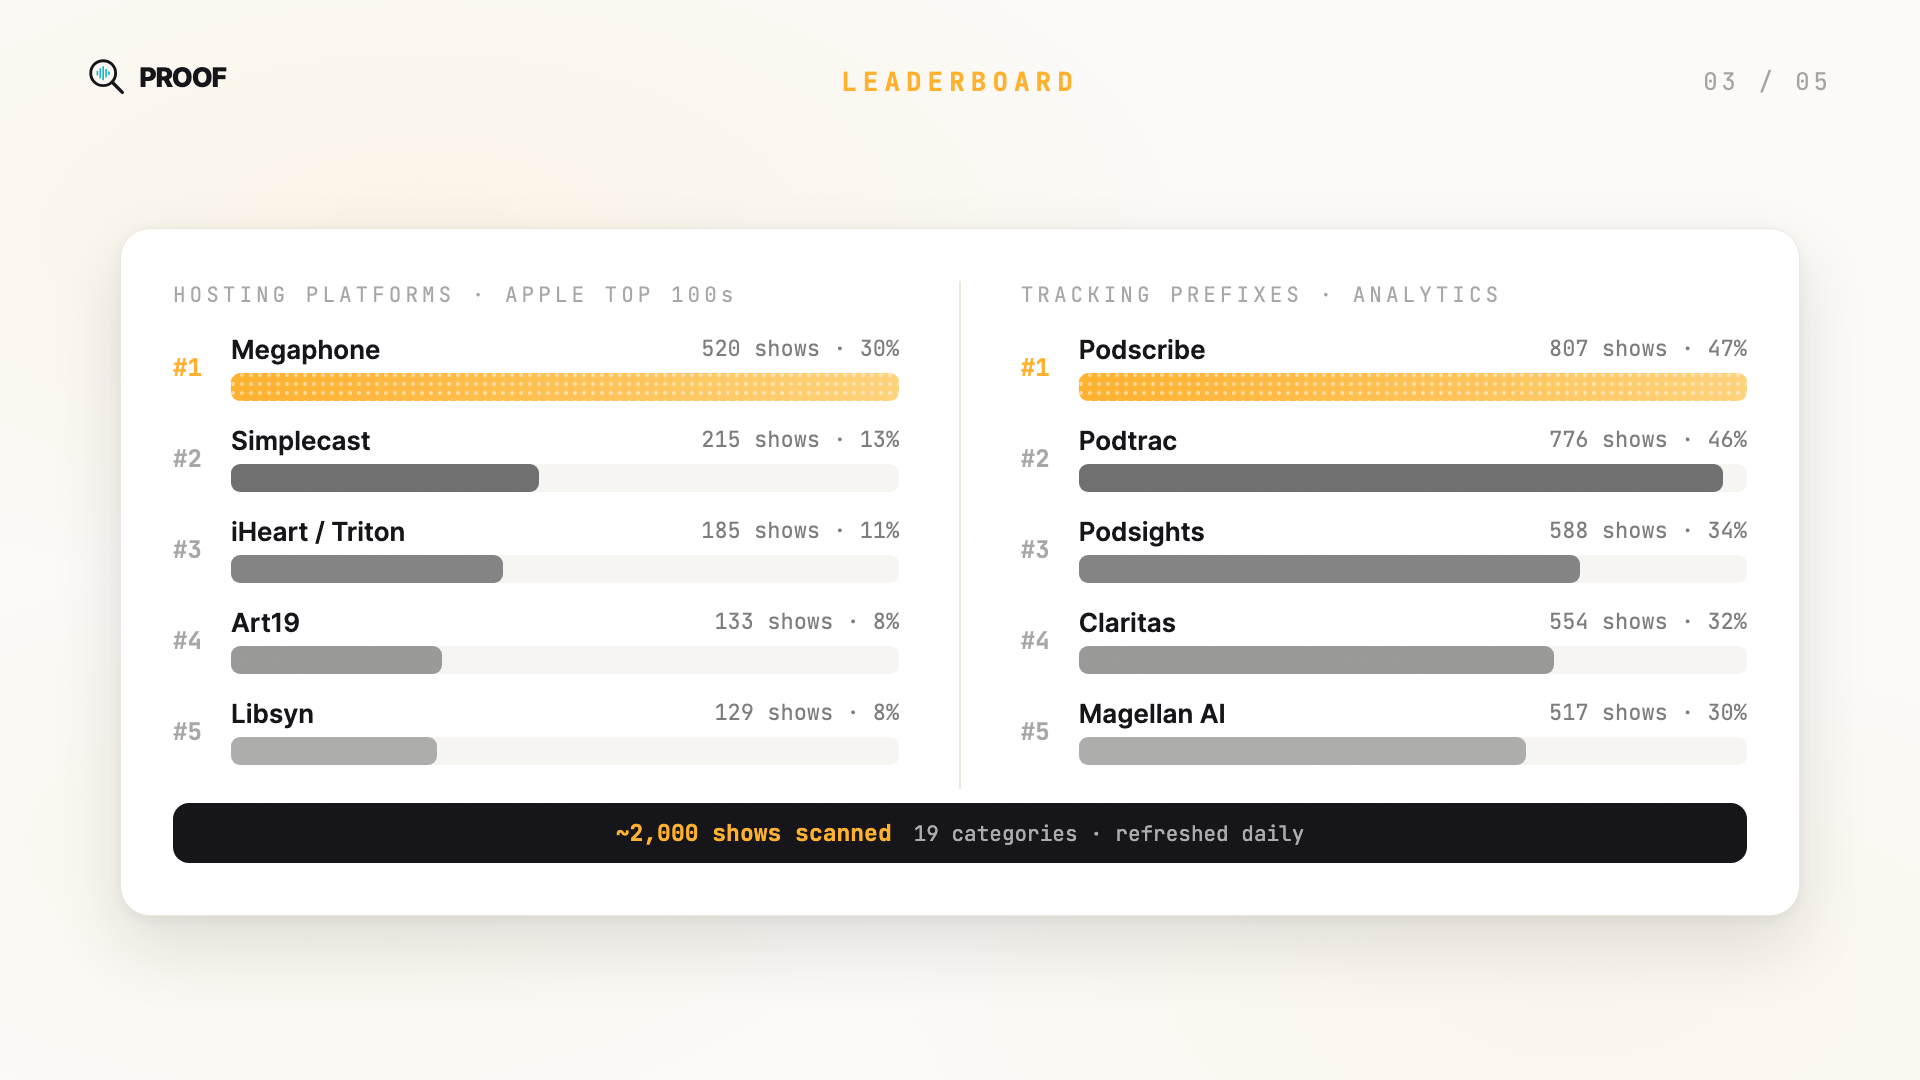
Hosting platforms and tracking prefixes ranked by real market share across the Top 100 shows in all 19 Apple Podcasts categories. Around 2,000 shows, rescanned daily.
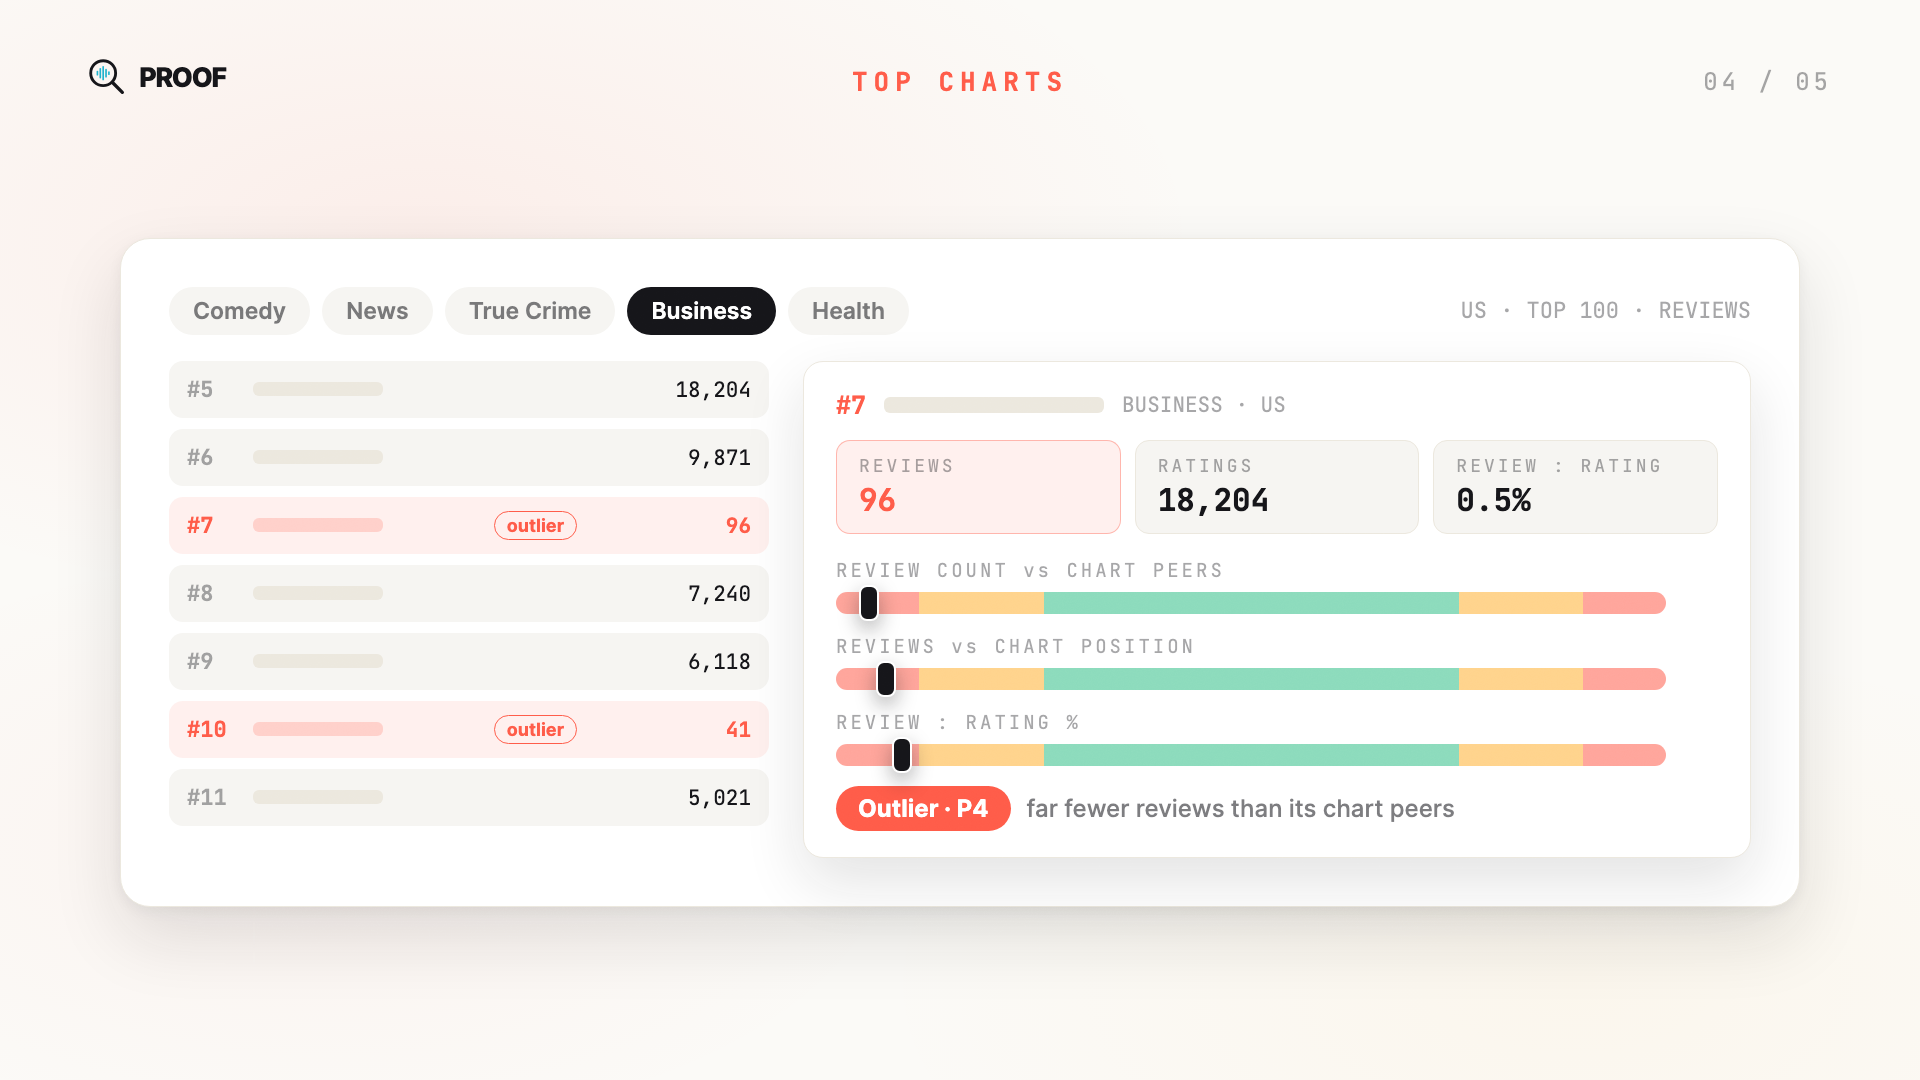
Reviews and ratings for every charting show, benchmarked into percentiles against its chart peers, by country and category. Shows with far fewer reviews than their peers are flagged as statistical outliers.
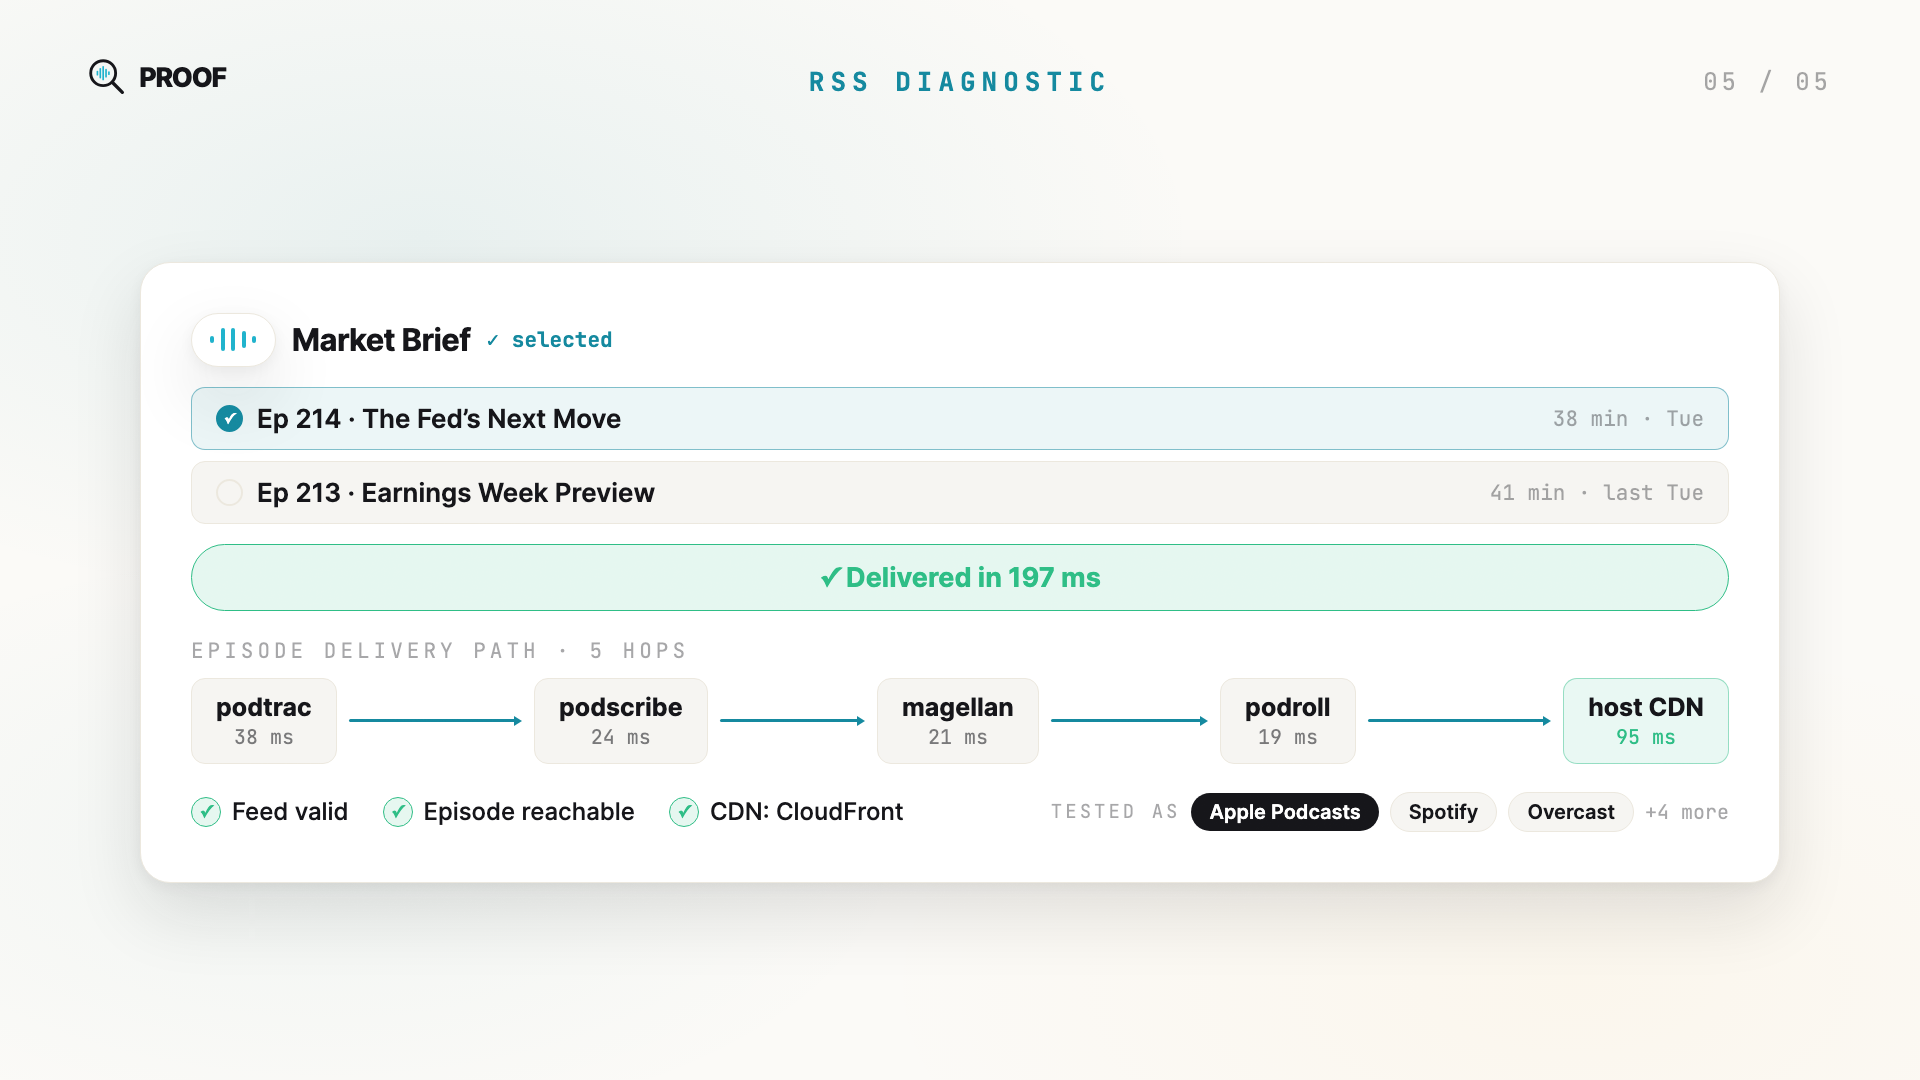
Paste a feed and trace every redirect hop an episode takes, validate the RSS, and see exactly what each app sees. Delivery is tested with the user agents of Apple Podcasts, Spotify, Overcast, and more.
The flagship PROOF Report analyzes a podcast's Apple reviews and ratings with statistical methods. Every review is scored across 12 independent signals, from temporal clustering to duplicate content, and benchmarked against charting shows.
Free to use. No login required.